MINIBLOK II: A PUSH-PULL TRIODE AMPLIFIER
by Fred Nachbaur, Dogstar Music ©2002

Part 1:
Introduction
Part 2:
How It Works
Part 3:
Performance
Part 4:
Construction
Part 5:
Parts List
Part 6:
Sound Sample


3: PERFORMANCE


A: Basic Performance Parameters

PARAMETER LOW (42:1) TAP HIGH (28:1) TAP
Max. Output power (8 ohms) 2.3 watts 3.5 watts
Max. Output power (4 ohms) 3.0 watts 3.4 watts
Effective Output Resistance 2.6 ohms 6.2 ohms

As shown in the table, output from the push-pull version of the MiniBlok is well over twice the power of the single-ended version. The reasons for this higher-than-expected output power are:
PARAMETER SPECIFICATION NOTES
Input Resistance 100 kilohm determined by volume control R6
Input Sensitivity 0.55 volts RMS min. input signal for full output
Low Frequency Response -3 dB @ 32 Hz. (-6 dB @ 22 Hz.)
High Frequency Response -3 dB @ 10.5 kHz. (-6 dB at 16 kHz.)
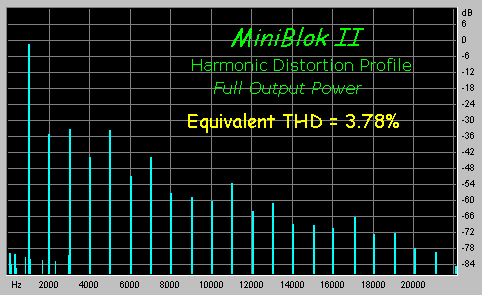
Maximum THD 3.78% calculated at full output
Typical THD 1.65% calculated at 1/2-voltage point
Hum and Noise ~ -80 dB relative to maximum output


Most of these figures are derived by actual measurement. The exception are the THD figures, which were computed from a spectrogram; the harmonic distortion behaviour is covered in further detail below.

Input resistance is the same as the SE version, since the same value of volume control pot is used. Input sensitivity is approximately doubled, however, because of the push-pull topology. Frequency response is a bit better, due to the larger gap-less output transformer used. Total Harmonic Distortion is approximately halved, both at full power and at more typical listening levels. Hum and noise are greatly reduced, partly because of the push-pull topology and partly because of the added power supply filter stage.

B: Harmonic Distortion

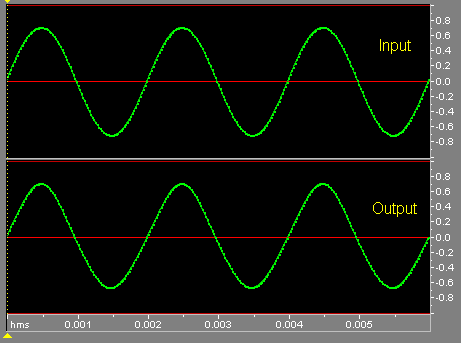
The top trace in the graph below is a real-time plot of a 500 Hz. sine wave applied to the amplifier. The bottom trace is the signal at its output, with the gain set such that the amplifier is just below the clipping point. (Output = 3.5 watts into 8 ohms).

Time-domain input/output graph
Time-domain graph at full output (3.5w), 8 ohms


Unlike the single-ended time-domain graph, there is very little visual difference between input and output, due to the much more symmetrical nature of the push-pull amplifier.

However, appearances in the time domain can be deceiving. Shown below is the harmonic distortion profile or "signature" of the MiniBlok II. While the total harmonic distortion is about 1/2 that of the single-ended version (representing 1/4 power, or about 6 dB less total harmonic distortion), it's still not insignificant.

THD at full output
Harmonic Distortion at full output

Note especially the significant decrease in even-order harmonics compared to the single-ended version due to the push-pull topology. The most significant contribution by the second harmonic is down 12 decibels! It should be noted that this is in spite of no attempts to match the output tubes, and a phase splitter not noted for its symmetry. If tubes are reasonably matched and a "cathodyne" or "long-tail pair" phase splitter is used, much greater even-order attenuation can be achieved, as in the case of the RA-100 design (using long-tail pair splitter).


Back Index Next
BACK HOME NEXT