|
Experiments in Psycho-Acoustics |
 |
| Note: This project can also be downloaded as a self-extracting zip file. Download and run acoust01.exe (1050k, last updated Sept. 17) then extract to a directory of choice (default is C:\psycho-acoustic). Double-click on acoust-0.htm to launch the project in your default browser. |
|
How do we perceive sound? Do our ears, nervous system, and brain function similarly to electronic
"hearing" devices such as microphones and recording equipment? Can sound affect the way
we think, feel and act? These and other questions fall under the science of "Psycho-Acoustics." While
I don't profess to be any sort of expert in this field (not being a professor of anything, for
that matter) I do have a few insights that I'd be happy to share, based on my experience as both
a musician and electronics technologist.
This is an interactive essay, complete with demonstrations in the form of mp3 files that illustrate the phenomena described. The only requirements are a computer capable of playing mp3's, a set of stereo headphones, and open ears and mind. I offer possible explanations for some of these phenomena that reflect my own experience and opinions, but I hope that any answers found here will open the door to deeper questions and further research. |
|
Introduction: Some Important Definitions
|
|
Let's start by defining some of the terms we'll be using in this discussion, so we don't get
bogged down in ambiguities. To keep this as accessible as possible, I'll try to express these
concepts in layman's terms rather than being absolutely precise. Please bear with me, these
concepts are important for understanding of the experiments that follow.
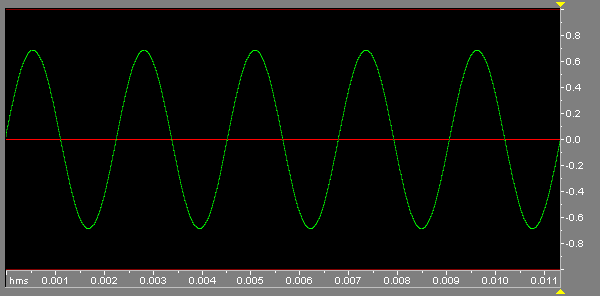
Sound: We all understand sound to be "that which is perceived by the ears." What physically occurs is that something (usually a physical object) vibrates, causing small variances in air pressure. These "sound waves" travel through the air, much like water waves travel along the surface of a pond when a stone is dropped into it. On reaching our ear drums, these waves cause a similar vibration to the original object in our ear drums. Again to use the water wave analogy, visualise a cork at the edge of the pond; it will bob up and down as the waves reach it. More generally, we often use the term "sound" to refer to any vibration in the audible range from about 20 vibrations per second to about 20,000 vibrations per second. We even refer colloquially to sound travelling through an amplifier or other electronic device, even though strictly speaking it isn't really sound until these electrical signals are converted to sound waves in air by a loudspeaker or similar device. More correctly, the signals inside a piece of electronic gear are analogs of the sound itself. Frequency: How many times something repeats in a given unit of time. If a tuning fork vibrates back and forth 440 times a second, the tone it creates is said to have a frequency of 440 Hertz. "Hertz" simply means "cycles per second", and was instituted to replaces the older term some years ago in honour of radio pioneer Heinrich Hertz. The higher the frequency, the higher the pitch that our ears perceive. Amplitude: Simply stated, amplitude is just how big something is. In terms of sound, amplitude generally equates to "volume" or "loudness", which are ways of expressing the idea of average amplitude. However, amplitude can also refer to the sound pressure level at a given moment in time (instantaneous amplitude) or to the peak level (peak amplitude) of a waveform or sound. Sine Wave: The sinusoidal waveform (or "sine wave") is the most basic repetitive pattern in existence. A sine wave consists of only one single frequency, without any "harmonics" or (in musicians' terms) "overtones". Here is how a sine wave looks if we plot instantaneous amplitude against time; the total time represented by the width of the graphs is 11.4 milliseconds (1/88 second). |
 |
|
Five cycles of a 440 Hz sine wave, with a relative peak amplitude of 0.7
|
| And here's how a sine wave sounds. (If your sound card supports reverb, chorus, 3D-wide or other effects, be sure to turn them off before listening to these samples and the ones that follow in the next section.) This is 2.5 seconds of 440 Hz (the A just below middle C). Click on the link below to launch your mp3 player or plugin: |

| 440 Hz. Sine Wave |
|
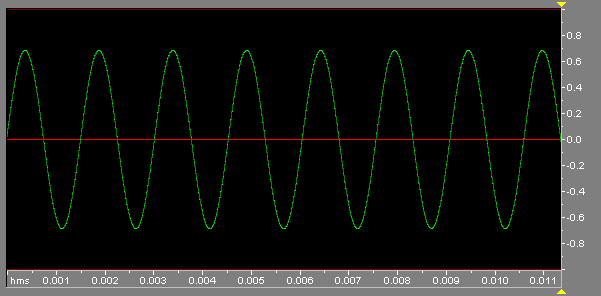
Now here is another sine wave, this time with a frequency of 660 Hz, or 1-1/2 times that of the
first wave. This corresponds to the E just above middle C, and is a "perfect fifth"
above the A=440 Hz. wave you listened to first. Note that the time scale is the same in the
graph below, but instead of five cycles there are now 7-1/2 cycles in the same 11.4 milliseconds:
|
 |
|
A 660 Hz sine wave; 50% more cycles squeezed into the same amount of time.
|
| Now listen to the higher frequency sine wave. This is 2.5 seconds of 660 Hz. Alternately play the two sounds until the pitch - frequency relationship is clear to you. |

| 660 Hz. Sine Wave |
|
Time Domain: The graphs you've seen thus far are said to be in the "time
domain." This simply means that we are viewing some quantity (amplitude) as time goes on.
The graphs above start at time=0 and show how amplitude varies up to time = approx. 11.4 msec.
The time domain is useful for simple signals, but rapidly becomes unwieldy with more complex
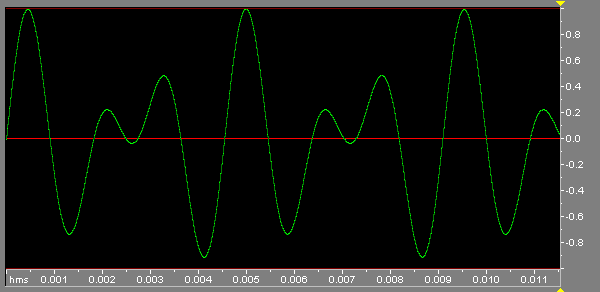
waveforms. For instance, if we add together the 440 Hz. and 660 Hz. waves above, we end up with
a time domain graph like this:
|
|
| A summed signal containing 440 Hz. and 660 Hz. sine waves, time domain |
|
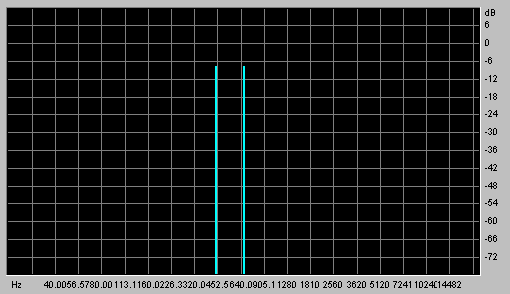
Frequency Domain: When dealing with multiple frequencies, it is often convenient to view response based on frequency rather than time. Such approaches are said to be in the "frequency domain." For example, if we add together the two waves (440 Hz. and 660 Hz.) above, we would end up with the frequency-domain plot shown below: |
|
| Frequency domain view of summed 440 Hz. + 660 Hz. sine waves |
|
Notice that this graph shows very clearly that there are equal amounts of 440 Hz. and 660 Hz. components. Furthermore, it shows that there are no other frequencies in the sound, which is not obvious from looking at the time-domain graph. Such frequency-domain graphs are also called "Spectrograms", since they display the sound in terms of a frequency spectrum. |
|
Summing and Mixing: One of the interesting properties of sine waves is that any
number of sine waves of differing frequencies and amplitudes can be added together, or
summed, without introducing any new frequencies. Any time frequencies are summed in a
linear system (stated simply, any system without distortion) only those frequencies applied to
the "inputs" will appear at the "output". They may be changed in relative
amplitude (such as when passing through tone controls or other filters) but will not generate any
new frequencies. The frequency-domain illustration above shows that only the original 440 Hz. and
660 Hz. waves appear in the summed wave shown in the time-domain illustration.
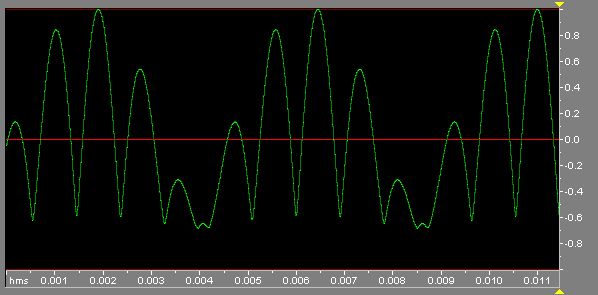
It is this characteristic of sine waves that make it possible for us to discern different instruments and tones within even very large ensembles such as orchestras. The fact that no new frequencies are generated when summing also explains how complex sound signals, not to mention dozens of very complex television signals can be transmitted over a single cable or wire. It should be noted that what sound and video people usually refer to as "mixing" would be more accurately called "summing" in our present context. Similarly, we refer to devices called "mixers", but for the purpose of this discussion we reserve the term "mixing" to mean something quite different. Specifically, Mixing occurs when two or more sine wave signals are applied to any system that is non-linear. An example would be a guitar or other instrument with a distortion pedal. Another example is provided by the difference in sound between a steel guitar and a violin. Both are the sound of a vibrating string, but while the steel guitar is almost a pure sine wave sound, the violin's sound is much more complex because of non-linearity in the violin's contruction, as well as in the way the bow hairs alternately grab and release the string. Under such circumstances, new frequencies will be created. Furthermore, the new frequencies will all be sums and differences of the original frequencies. There are an infinite number of possibilities for mixing, depending on the exact nature of the non-linearity used. The kind of distortion used will affect the amplitude distribution of the mixing products, but not the frequencies: new frequencies will always be sums and differences of the original signals, and integral multiples thereof. By " integral multiples" we mean multiplied by integers, i.e. 2, 3, 4 etc. These are also called harmonics or overtones. As an example, here is a time-domain picture of our 440 Hz. and 660 Hz. sine waves, after being summed and then applied to an "RMS filter", one kind of distortion that essentially squares each point on the summed signal: |
 |
|
A mixed signal based on 440 Hz. and 660 Hz. sine waves, time domain
|
|
In the time-domain view, this signal does not look all that different from the summed signal
shown above, and there's certainly no indication that there are any frequencies other than those
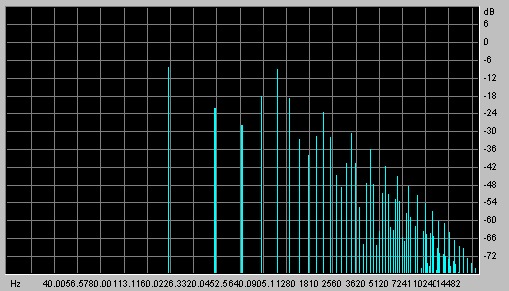
we started with. However, let's take a look at the frequency domain spectrogram of this signal:
|
 |
|
Spectrogram of a mixed signal based on 440 Hz. and 660 Hz. sine waves
|
|
The original frequencies, shown in bold, are still clearly present, although somewhat lower in
amplitude. However, note that we now also have a very pronounced line at 220 Hz. (660 minus
440 Hz.), an octave below the 440 Hz. tone, representing the difference signal. There is
also a very pronounced line at 1100 Hz. (660 plus 440 Hz.) which is the sum of the two
original frequencies. What's more, there are lines at every multiple of the difference frequency
(220 Hz.) Note that the sum frequency (1100 Hz.) is itself a multiple of the difference frequency
(220 Hz.); one of the reasons I chose these two frequencies for this example is to keep these
graphs relatively simple and easy to understand.
And now, the moment we've all been waiting for. We've covered the groundwork and are finally ready to do some "ears-on" experimentation. |
Back to Fred's Freebies
Other interesting sites on Psycho-Acoustics:
Nakajima-Lab: Auditory Illusions and Tricks
Scientific American: Analysis: Dissecting the Brain with Sounds

To Dogstar Music's Home