A LOW-COST SINGLE-ENDED TRIODE AMPLIFIER
by Fred Nachbaur, Dogstar Music ©2002

Part 1:
Introduction
Part 2:
How It Works
Part 3:
Performance
Part 4:
Construction
Part 5:
Parts List
Part 6:
Sound Sample


3: PERFORMANCE


Now we'll have a look at the performance characteristics of this simple amplifier. First a few numbers, then we'll have a look at some pretty graphs that help describe this design's electrical and acoustic properties.

A: Basic Performance Parameters

PARAMETER SPECIFICATION NOTES
Max. Output power (8 ohms) 1 watt before onset of clipping
Max. Output power (4 ohms) 1.15 watt before onset of clipping
Effective Output Resistance 6.6 ohms measured at full output
Input Resistance 100 kilohm determined by volume control R6
Input Sensitivity 0.9 volts RMS min. input signal for full output
Low Frequency Response -3 dB @ 40 Hz. (-6 dB @ 25 Hz.)
High Frequency Response -3 dB @ 9 kHz. (-6 dB at 15 kHz.)
Maximum THD 6.74% calculated at full output
Typical THD 2.52% calculated at 1/2-voltage point
Hum and Noise < -63 dB relative to maximum output


Most of these figures are derived by actual measurement. The exception are the THD figures, which were computed from a spectrogram; the harmonic distortion behaviour is covered in further detail below. (From here on, the discussion gets a bit technical. Don't worry if it's over your head, this information isn't needed for building and enjoying this project. However, it may help your understanding of tube amplifiers in general, and single-ended triode amps specifically.)


B: Frequency Response

As indicated in the table above, the low-frequency response is quite impressive for such a small amplifier. The 3 dB "corner frequency" is around 40 Hz, and there is usable output (- 6 dB) all the way down to 25 Hz. This is one advantage of the air-gapped output transformers required for proper single-ended operation.

On the down side, the high-frequency response is nothing to write home about, with the 3 dB corner at 9 kHz, and usable output to about 15 kHz (-6 dB). However, slightly more advance experimenters can at least partially compensate for this by adding a high-pass filter with the appropriate corner frequency. However, this will also generally require more gain than is available in this simple design, so this option will not be pursued any further in the present treatment.


C: Harmonic Distortion

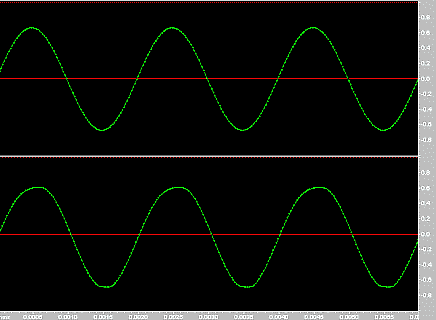
The top trace in the graph below is a real-time plot of a 500 Hz. sine wave applied to the amplifier. The bottom trace is the signal at its output, with the gain set such that the amplifier is just below the clipping point. (Output = 1 watt into 8 ohms). Note that the input and output signals are in-phase, because the signal has been inverted twice (once by the preamp stage, once by the power amp stage).

Time-domain input/output graph
Time-domain graph at 1-watt output, 8 ohms


There are a couple aspects that bear pointing out. First, the bottom half of the wave peaks are just starting to flatten out. This is because the grid voltage is just starting to pass the 0 volt point, causing it to draw current, and signalling the onset of clipping.

The top half of the wave peaks, on the other hand, do not exhibit this flattening effect. If you'll look at the loadline graph again, you'll see why; at the -72 volt point, the loadline still has a ways to go before it bottoms out (clips) by intersecting the x-axis.

Furthermore, the shapes of the two half-cycles are quite different. The bottom half is quite like the classic sine-wave shape, but the top half is noticeably broadened. This is a real-time "picture" of the non-linearity we noticed by examining the loadline in our characteristic plate curves graph above.

This difference in shape between the two half-cycles is important, since it is a unique characteristic of single-ended amplifiers. A properly set up push-pull amplifier, by contrast, will have top and bottom half-cycles that are mirror images of each other; in other words, a push-pull amplifier's output will be symmetrical around the x-axis. It can be proven using a branch of mathematics called Fourier Analysis, that when such symmetry exists, all even-order harmonics will be cancelled out. In other words, a single-ended amplifer will have significant even-order harmonic content in addition to odd-order harmonics. This is demonstrated in the next section.

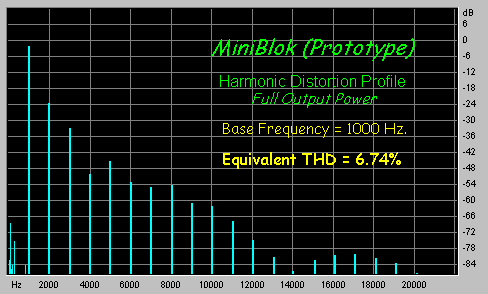
So far we've only taken a qualitative look at non-linearity (and resulting distortion). While there are graphical methods of estimating harmonic distortion from the loadline graph, we have a far more powerful tool at our ready disposal; the computer running Fast Fourier Transform (FFT) software. Using this tool we can actually measure and plot the harmonic content of a wave with ease and precision. The graph below shows the harmonic "signature" of the very waveform shown in the previous figure (except that the test frequency has been increased to 1 kHz). Note that instead of looking at the signal in the "time domain" (horizontal axis = time) we are now looking at it in the "frequency domain" (horizontal axis = frequency).

THD at full output
Harmonic Distortion at full output

It can be proven that any repetitive waveform can be expressed as a series of discrete frequencies, at integer multiples of the fundamental frequency. These frequencies are called "harmonics", and in the case of high-fidelity amplifiers, represent distortion of the original signal.

The graph above shows the harmonic spectrum of the output of the MiniBlok amp, right on the verge of clipping. The tallest line (at 1000 Hz) represents our frequency of interest; all the rest are harmonics. If these harmonics are all added together, their net effect can be expressed as "Total Harmonic Distortion" (THD); have a look at this article for details on how the number is derived.

Note that the most significant harmonic is the 2nd harmonic, i.e. at 2000 Hz. on the graph. Each successive higher harmonic up to the 14th is less again, by which point the harmonic energy is negligible. If the 2nd harmonic were removed, the THD would drop to 2.36%. So it's obvious that the "lion's share" of the harmonic distortion is in the 2nd harmonic term. If the 2nd and 3rd were removed, THD would drop to 0.74%.

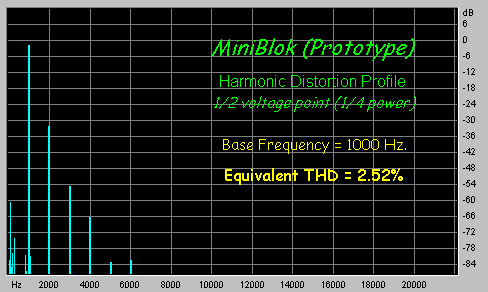
So that's with the amplifier running full-out, right on the verge of break-up. How does it look at more reasonable levels? The graph below shows the harmonic spectrum at 1/2 output voltage (equates to 1/4 output power).

THD at 25% output power
Harmonic Distortion at 25% output power

What a difference! THD drops down to 2.52%, with harmonic content beyond the 4th harmonic virtually nonexistant. If the 2nd is removed from the computation, THD decreases to 0.21%. So, in a more normal operating region, the 2nd harmonic is by far the preponderant harmonic component.

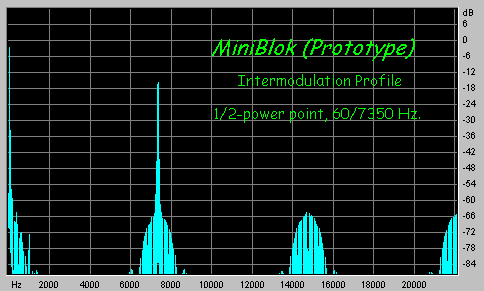
Finally, for the sake of completeness, here is a graph of the amplifier's Intermodulation Distortion characteristic. This is actually marginally better than the "grid-enhanced cathode-coupled paraphase" I did just before this project.

Intermod at 50% output power
Intermodulation Distortion at 1/2-power point


D: The Soap Box

This is where I express my "considered opinion" regarding the single-ended triode topology, its signature sound, and the SET mythos. If you haven't yet listened to the comparative
sound samples, or if you want to avoid reading my editorial until you've had a chance to experiment yourself, you may want to skip this for now. Otherwise, scroll down a screen-full or so.

Back Index Next
BACK INDEX NEXT


spacer

My Take on the "SET Mythos"

In general, looking at the THD figures or the harmonic content, you'd think that this amp is "the sheets". But not at all, it sounds wonderful! There is a certain "vibrance" or "presence" that seems to jump out at you while listening. SET enthusiasts have long pointed to this phenomenon, sometimes waxing quite poetic when describing the sound of their amplifiers. I think I have gotten a bit of a handle on the SET mystique after all this building, listening, testing, and writing...

The SET is not more accurate than a PP triode (or beam tetrode, for that matter) design. The graphs and numbers show that it's worse. But it can sound better! Why is that?

I'm convinced that it's that second harmonic that creates an octave "image" of the entire musical content. This gives the illusion of tightness, accuracy, "air", whatever you want to call it. Furthermore, this effect increases with volume, virtually disappearing at low levels and coming on "great guns" at maximum output.

But if you close your eyes and really try to objectively listen, you realize that the sound is - while pleasant - definitely coloured. I listened to a whole bunch of Mozart on the MiniBlok the day after I finished building it; and quite frankly, my ears were tired -- which they never are after extended visits with Wolfie on any of my PP amps.

So there we have it. Another mystery of the universe unravelled. :-)

For me, push-pull is still the topology of choice for my main system. However, I enjoy listening to the little MiniBlok in my shop, at relatively low levels and without deeply concentrated listening. I can also see the SET being a real boon for centre-channel or rear-channel "fill-in" amplifiers, to give just that touch of "air" to the listening experience. Another interesting effect I've noticed (and have heard similar reports from others): the SET can enhance the 3-dimensional effect of stereo recordings. I surmise that this is because of phase differences between the fundamental and the second harmonic "octave image".

Finally, to answer the question that would inevitably come up anyway, here is what I hear when listening to the sound-sample demo. Right off, I hear the residual (-63 dB) 60/120 Hz. hum. (To be as fair as possible, this is an exact recording.) The opening chords are thicker and gutsier than the source version, enhancing the startling quality that Beethoven wrote into them. The timpani hits are especially penetrating, almost shocking. The quiet theme that follows sounds pretty much exactly the same as the source signal. However, during the crescendo, the entire soundstage seems to gradually broaden, and the music takes flight - culminating again with that thick, gutsy sound at the end.

So have I finally lost it and gotten myself brainwashed into the SET cult? Or am I starting to see the light? I'll let you be the judge.

Back Index Next
BACK INDEX NEXT